Intelie Live - Dashboard Performance Report
Team:
- Rafael Campanari (Leader and front-end developer)
- Jefferson Domingos (Product Designer)
- Rômulo Ponciano (Full-stack developer)
Product Overview
Intelie Live is a platform that offers real-time data analytics. It also offers management and operational intelligence for companies in different sectors.
Priority Issue
Advanced users had a hard time figuring out the reasons for performance issues on some dashboards.
Introduction
Dashboards are one of the most important tools in the Live platform. Advanced users with administrator-level permission build dashboards and configure widgets, which can sometimes cause performance issues.
First things first
To help the team build an adequate solution, I had to learn more about the users of that specific task of building and managing dashboards.
The answer is within the user
According to users, performance issues were caused by a combination of technical difficulties. We knew our job would be to empower users to identify the causes of the problems and give them tools to act.

It's ideation time!
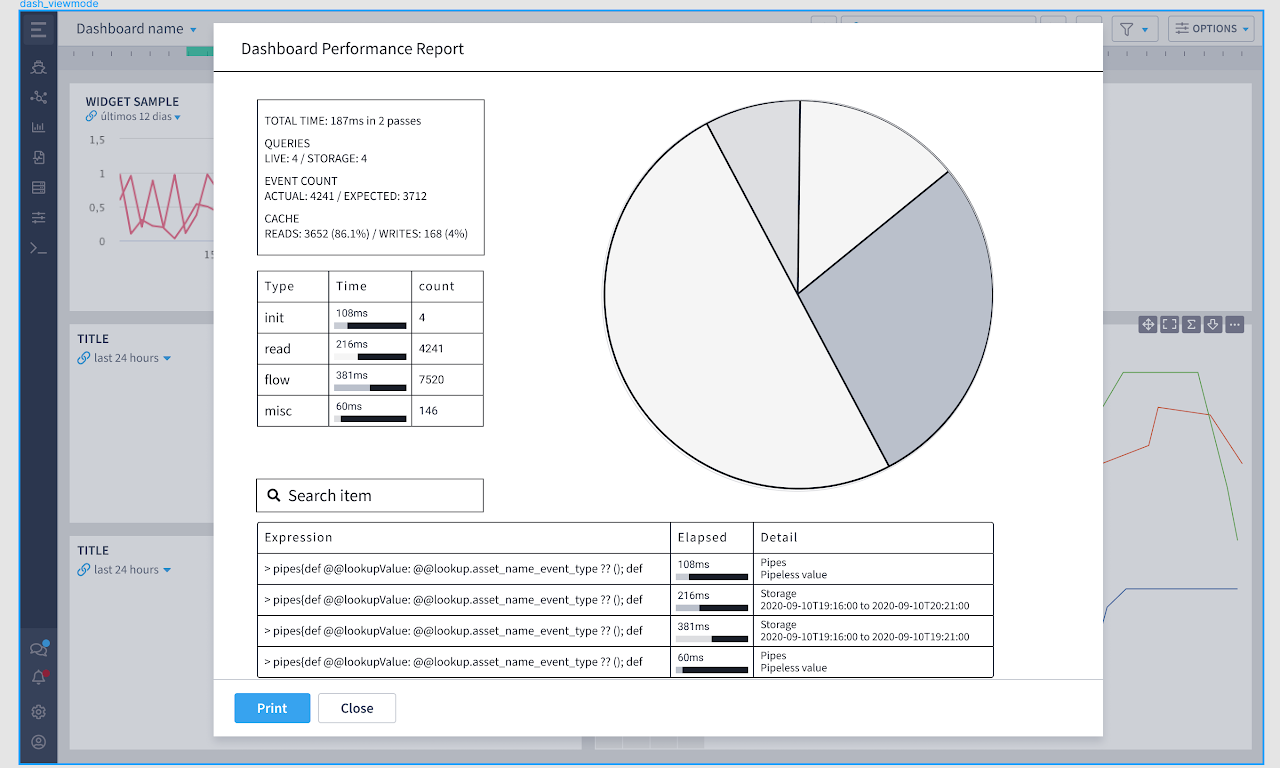
I designed a "Dashboard Performance Report" — a feature that gathers performance information and allows filters for users to inspect each dashboard element's performance attributes.
OK, genie of the lamp, wait a minute!
As designers, we should stretch the limits, but we also have to keep humble and work together. The most important thing is that we're all a team going for the same goal.
Prototypes are ready for development
After delivering the prototypes, I kept working with developers, helping out with any doubts about the user flow, interactions, and visual interface.
It's deployed! But it needs adjustments
The feature is working in the test environment. There were minor issues, mostly visual corrections, and the feature is ready for the next release.
How is it doing?
Since its rollout, the feature has received lots of good feedback from users, and we're already looking into expanding its sharing options.